Introduction
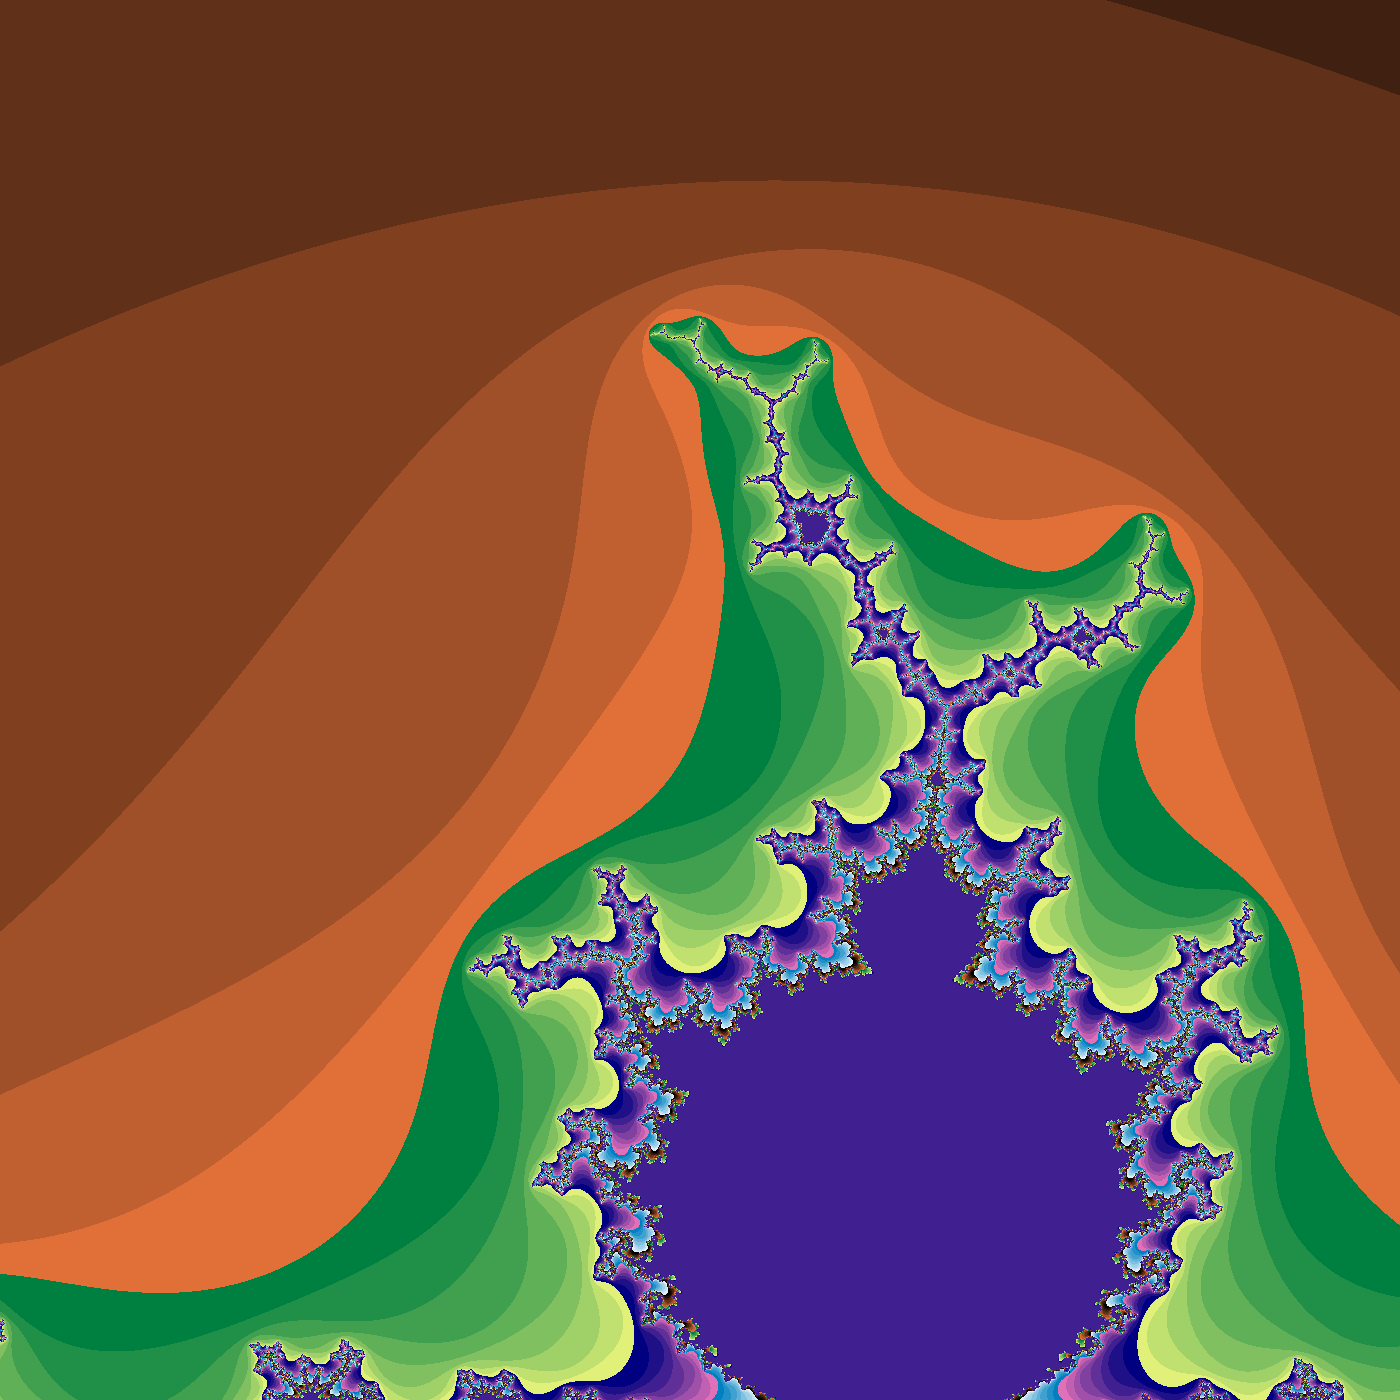
The Mandelbrot Set is one of the most famous and visually captivating mathematical objects in history. Named after Benoit Mandelbrot, a French-American mathematician who heavily researched fractals, the Mandelbrot Set is an infinitely intricate and self-similar fractal that represents the boundary between the converging and diverging points in the complex plane under the iteration of a simple quadratic function. My motivation for this project was to create an interactive and engaging way for users to explore the beauty and complexity of the Mandelbrot Set, while also gaining a deeper understanding of the underlying mathematics.
Mathematical Description
The Mandelbrot Set is defined using the following iterative formula:
\[z_{n+1} = z_n^2 + c\]Where $z$ is a complex number and $c$ is a complex constant. The Mandelbrot Set is the set of all complex numbers $c$ for which the sequence $z_n$ remains bounded, i.e., it does not tend towards infinity as $n \to \infty$.
To determine whether a complex number $c$ is in the Mandelbrot Set, we iterate the formula above, starting with $z_0 = 0$. If, after a certain number of iterations, the magnitude of $z_n$ (i.e., its distance from the origin) remains below a certain threshold, we consider the point $c$ to be part of the Mandelbrot Set.
Pseudocode
The following pseudocode shows the algorithm used to generate the Mandelbrot Set:
Copy code
function mandelbrot(c, max_iterations):
    z = 0
    n = 0

    while abs(z) <= 2 and n < max_iterations:
        z = z * z + c
        n = n + 1

    return n
Using this function, we can generate an image of the Mandelbrot Set by iterating over each pixel in the image, mapping the pixel coordinates to a complex number $c$, and checking whether it is part of the Mandelbrot Set using the mandelbrot function. If the function returns a value less than max_iterations, we can color the pixel based on the number of iterations it took to escape the threshold.
for each pixel (x, y) in the image:
    c = map_pixel_to_complex_plane(x, y)
    n = mandelbrot(c, max_iterations)

    if n == max_iterations:
        color = black
    else:
        color = choose_color(n)

    set_pixel_color(x, y, color)
In this project, I have implemented this algorithm using JavaScript and the HTML5 Canvas API, allowing users to interactively explore the Mandelbrot Set by panning and zooming. The zoom and pan features are optimized to only recalculate the Mandelbrot Set when necessary, providing a smooth user experience.
Enjoy exploring the fascinating world of the Mandelbrot Set with this interactive visualization!

